
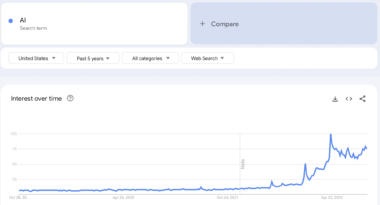
- Google trends data suggest that searches for “AI” have increased by 375% between October 2022 and October 2023.
- Data reveals that the best US state for AI nerds is California.
If AI enthusiasts had a kingdom, it would probably look a lot like this US State.
A new study by H18YC reveals that California has emerged as the premier destination for AI enthusiasts seeking unparalleled opportunities and a thriving community.
The state ranks second in the nation for quality of life, while also offering the most AI-focused educational programs (73) and hosting the most AI conferences (16) in 2023. With over 3,500 AI research labs and companies, California is truly the epicenter of AI innovation.
Methodology
Identification of AI Hubs: We initiated our research by identifying states with a substantial presence of AI research labs and companies. This step allowed us to pinpoint regions at the forefront of AI innovation and development.
Exploration of AI Events: Next, we scoured data to locate states that regularly host AI conferences and events. These gatherings serve as invaluable platforms for staying updated on the latest AI trends and fostering connections within the AI community.
Evaluation of Educational Opportunities: To assess educational and training prospects, we considered states offering diverse options such as university programs, bootcamps, and workshops. Access to robust learning resources is vital for AI enthusiasts seeking skill advancement.
Cost of Living Analysis: We analyzed the cost of living in each state to provide a practical perspective for those considering a move. This factor is particularly crucial for individuals planning to reside in a state for an extended period.
Quality of Life Assessment: Finally, we evaluated the overall quality of life in each US state. As, a well-rounded AI experience involves not only career opportunities but also a fulfilling lifestyle.
Calculations
| State | Quality of Life Rate | Cost of Living Index | No. of AI Educational Programs | No. of AI Conferences & Events | No. of AI Research Labs and Companies | Quality of Life Points | Cost of Living Index points(out of 20) | No. of AI Educational Programs Points | No. of AI Conferences and Events Points | No. of AI Research Labs and Companies Points | Sum |
| California | 7.4 | 123.1 | 73 | 16 | 3543 | 7.4 | 7.69 | 7.3 | 10 | 10 | 42.39 |
| New York | 7.4 | 93.6 | 48 | 9 | 176 | 7.4 | 10.64 | 4.8 | 9 | 1.76 | 33.6 |
| Massachusetts | 7.9 | 97.2 | 45 | 7 | 254 | 7.9 | 10.28 | 4.5 | 7 | 2.54 | 32.22 |
| Colorado | 7.8 | 96.2 | 26 | 2 | 682 | 7.8 | 10.38 | 2.6 | 2 | 6.82 | 29.6 |
| Alabama | 6.5 | 84.1 | 13 | 1 | 841 | 6.5 | 11.59 | 1.3 | 1 | 8.41 | 28.8 |
| Illinois | 7.6 | 99.2 | 43 | 3 | 365 | 7.6 | 10.08 | 4.3 | 3 | 3.65 | 28.63 |
| Arizona | 6.9 | 101 | 10 | 1 | 1,254 | 6.9 | 9.9 | 1 | 1 | 9.8 | 28.6 |
| Arkansas | 6.6 | 85.7 | 8 | 0 | 1,092 | 6.6 | 11.43 | 0.8 | 0 | 9.7 | 28.53 |
| Texas | 6.8 | 95.7 | 52 | 3 | 135 | 6.8 | 10.43 | 5.2 | 3 | 1.35 | 26.78 |
| Georgia | 6.8 | 92.4 | 28 | 2 | 396 | 6.8 | 10.76 | 2.8 | 2 | 3.96 | 26.32 |
| Alaska | 6.2 | 106.7 | 4 | 0 | 1,567 | 6.2 | 9.33 | 0.4 | 0 | 9.9 | 25.83 |
| Connecticut | 7.5 | 97.4 | 14 | 1 | 547 | 7.5 | 10.26 | 1.4 | 1 | 5.47 | 25.63 |
| Michigan | 7.4 | 95.1 | 39 | 1 | 242 | 7.4 | 10.49 | 3.9 | 1 | 2.42 | 25.21 |
| Maryland | 7.6 | 98 | 23 | 2 | 282 | 7.6 | 10.2 | 2.3 | 2 | 2.82 | 24.92 |
| Indiana | 7.4 | 91.2 | 21 | 1 | 348 | 7.4 | 10.88 | 2.1 | 1 | 3.48 | 24.86 |
| North Carolina | 7.2 | 92.6 | 30 | 2 | 171 | 7.2 | 10.74 | 3 | 2 | 1.71 | 24.65 |
| Pennsylvania | 7.5 | 102.1 | 38 | 2 | 153 | 7.5 | 9.79 | 3.8 | 2 | 1.53 | 24.62 |
| Ohio | 7.3 | 87.5 | 34 | 1 | 164 | 7.3 | 11.25 | 3.4 | 1 | 1.64 | 24.59 |
| Iowa | 7.8 | 90.1 | 11 | 1 | 342 | 7.8 | 10.99 | 1.1 | 1 | 3.42 | 24.31 |
| Minnesota | 7.9 | 96 | 27 | 1 | 227 | 7.9 | 10.4 | 2.7 | 1 | 2.27 | 24.27 |
| New Jersey | 7.5 | 96.3 | 23 | 2 | 184 | 7.5 | 10.37 | 2.3 | 2 | 1.84 | 24.01 |
| Virginia | 7.6 | 98.5 | 28 | 2 | 126 | 7.6 | 10.15 | 2.8 | 2 | 1.26 | 23.81 |
| Florida | 7 | 108.2 | 32 | 425 | 7 | 9.18 | 3.2 | 4.25 | 23.63 | ||
| Kansas | 7.1 | 90.4 | 10 | 1 | 331 | 7.1 | 10.96 | 1 | 1 | 3.31 | 23.37 |
| Delaware | 7.3 | 101.3 | 6 | 1 | 453 | 7.3 | 9.87 | 0.6 | 1 | 4.53 | 23.3 |
| Kentucky | 6.8 | 86.1 | 11 | 1 | 298 | 6.8 | 11.39 | 1.1 | 1 | 2.98 | 23.27 |
| Washington | 8.1 | 135.2 | 34 | 4 | 123 | 8.1 | 6.48 | 3.4 | 4 | 1.23 | 23.21 |
| Missouri | 7.1 | 90.8 | 19 | 1 | 216 | 7.1 | 10.92 | 1.9 | 1 | 2.16 | 23.08 |
| Idaho | 8 | 94.6 | 7 | 0 | 378 | 8 | 10.54 | 0.7 | 0 | 3.78 | 23.02 |
| Oregon | 7.7 | 94.4 | 21 | 1 | 156 | 7.7 | 10.56 | 2.1 | 1 | 1.56 | 22.92 |
| Wisconsin | 7.7 | 92.7 | 22 | 1 | 117 | 7.7 | 10.73 | 2.2 | 1 | 1.17 | 22.8 |
| Maine | 7.5 | 95.5 | 5 | 1 | 287 | 7.5 | 10.45 | 0.5 | 1 | 2.87 | 22.32 |
| Louisiana | 6.4 | 93.3 | 12 | 1 | 293 | 6.4 | 10.67 | 1.2 | 1 | 2.93 | 22.2 |
| Utah | 8.2 | 96.1 | 12 | 1 | 132 | 8.2 | 10.39 | 1.2 | 1 | 1.32 | 22.11 |
| South Carolina | 6.5 | 92 | 19 | 1 | 147 | 6.5 | 10.8 | 1.9 | 1 | 1.47 | 21.67 |
| Tennessee | 7 | 95.3 | 18 | 1 | 138 | 7 | 10.47 | 1.8 | 1 | 1.38 | 21.65 |
| New Hampshire | 7.7 | 100.7 | 10 | 1 | 187 | 7.7 | 9.93 | 1 | 1 | 1.87 | 21.5 |
| Nebraska | 7.9 | 102.3 | 7 | 1 | 197 | 7.9 | 9.77 | 0.7 | 1 | 1.97 | 21.34 |
| Mississippi | 6.6 | 83.4 | 8 | 0 | 220 | 6.6 | 11.66 | 0.8 | 0 | 2.2 | 21.26 |
| Vermont | 7.7 | 94.1 | 6 | 1 | 129 | 7.7 | 10.59 | 0.6 | 1 | 1.29 | 21.18 |
| Oklahoma | 6.7 | 97.3 | 16 | 1 | 159 | 6.7 | 10.27 | 1.6 | 1 | 1.59 | 21.16 |
| West Virginia | 6.9 | 86.4 | 6 | 1 | 120 | 6.9 | 11.36 | 0.6 | 1 | 1.2 | 21.06 |
| New Mexico | 7.2 | 97.1 | 7 | 1 | 179 | 7.2 | 10.29 | 0.7 | 1 | 1.79 | 20.98 |
| Hawaii | 6.1 | 105.5 | 5 | 1 | 389 | 6.1 | 9.45 | 0.5 | 1 | 3.89 | 20.94 |
| North Dakota | 7.8 | 92.2 | 4 | 0 | 169 | 7.8 | 10.78 | 0.4 | 0 | 1.69 | 20.67 |
| South Dakota | 7.1 | 88.6 | 5 | 0 | 144 | 7.1 | 11.14 | 0.5 | 0 | 1.44 | 20.18 |
| Nevada | 6.3 | 98.1 | 6 | 1 | 192 | 6.3 | 10.19 | 0.6 | 1 | 1.92 | 20.01 |
| Rhode Island | 5.9 | 93.4 | 8 | 1 | 150 | 5.9 | 10.66 | 0.8 | 1 | 1.5 | 19.86 |
| Montana | 6.1 | 91.1 | 6 | 0 | 210 | 6.1 | 10.89 | 0.6 | 0 | 2.1 | 19.69 |
| Wyoming | 6.4 | 89.1 | 4 | 0 | 114 | 6.4 | 11.09 | 0.4 | 0 | 1.14 | 19.03 |
Sources
- Quality of Life Index- U.S. News & World Report 2023-2024 Best States rankings:
- Cost of living – US News & World Report 2023 Best States rankings.
- Number of AI educational programs-College Navigator, US News & World Report, Coursera Udacity
- Number of AI conferences and events- Ai Connects
- Number of AI research labs and companies- PitchBook, CB Insights